
How a visual history of Antarctica enabled researcher to chronicle the impact of climate change
More than 300,000 US Navy images vital to helping Ryan North examine collapsing ice shelves and glacial melt

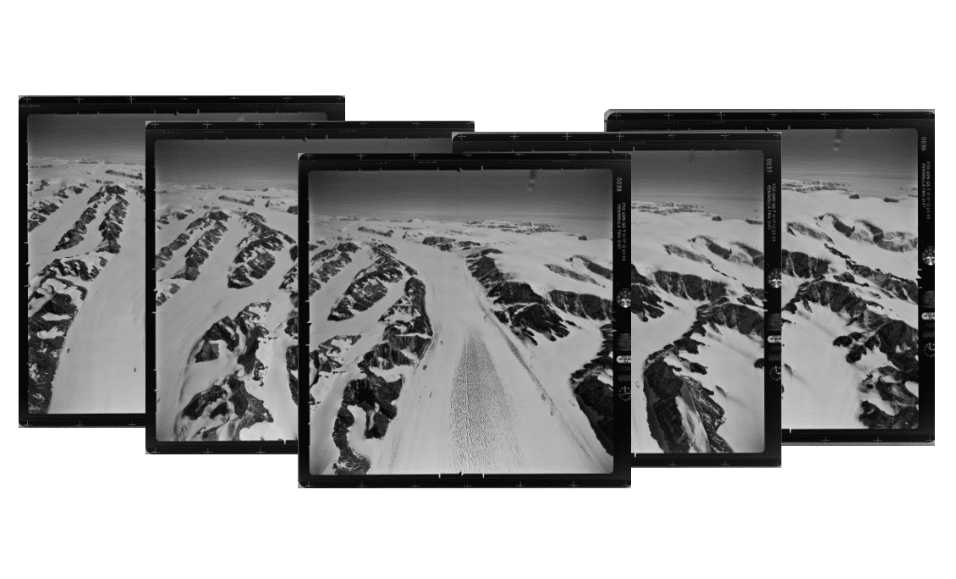
Ryan North. Credit: Michael Gray / UoW Overlapping images of Crane Glacier in 1968. Credit: Polar Geospatial Centre, University of Minnestoa Still from 3D model that shows how the glaciers looked in 1968.

Cartographers from the United States Navy spent more than five decades photographing Antarctica from the air. The result was more than 300,000 high-quality images on large format film, visually mapping almost every corner of the vast continent from 1946 to 2000.
When Ryan North, a PhD candidate at the University of Wollongong (UOW) and SAEF Associate Investigator, set out to study the landscape evolution and climate impacts in Antarctica, this underutilised archive proved invaluable.
A new research paper co-authored by Professor Timothy Barrows at the University of New South Wales, titled ‘High-resolution elevation models of Larsen B glaciers extracted from 1960s imagery’, has been published in the journal Scientific Reports. It captures Ryan’s painstaking work to examine how the collapse of ice shelves and glacial melt contributes to rising sea levels.
Using the historical imagery gathered by the US Navy, now freely available at the Polar Geospatial Center at the University of Minnesota, Ryan focused on the collapse of the Larsen-B Ice Shelf on the Antarctic Peninsula that took place over a week in 2002.
The ice shelf was 3250 square kilometres, an area equivalent to Greater Sydney and Wollongong combined.
Ice shelves are the thick floating bodies of ice attached to land. Under the right conditions, they can remain stable for thousands of years. Although the collapse of ice shelves does not directly cause sea-level rise, ice shelves ‘hold back’ the glaciers, and once removed, glaciers can release colossal amounts of ice from the land to the ocean, which leads to rising sea levels.
After an ice shelf collapses, tributary glaciers (glaciers that flow into an ice shelf) accelerate and thin without the protection of the ice shelf.
Ryan used the historical images to measure how much ice was held in five glaciers 35 years before they were impacted by the collapse of the Larsen-B ice shelf.
“After constructing an accurate 3D-model of the landscape using more than 850 photos, I found the glaciers were essentially unchanged between 1967 and 2001, just before the collapse occurred,” Ryan said.
“After the collapse, I measured at least 35 billion tons of land-based ice was lost to the ocean from five glaciers. From Crane Glacier, it was 28 billion tons alone. This is the equivalent to every single person on Earth tipping out a one litre water bottle every day for 10 years.”

Ryan said understanding glacial melt helps predict how sea levels will rise in the future. But it has been difficult in the past to gain a long-term perspective of how the landscape has shifted in Antarctica.
“Since the 1970s, seven out of 12 ice shelves on the Antarctic Peninsula have rapidly collapsed or retreated significantly. These collapses have been attributed to unusually warm temperatures. The Antarctic Peninsula is one of the fastest warming environments on Earth, with an average yearly air temperature of increase of 2.5 °C from the 1950s to the 2000s, and a substantial warming of subsurface waters.
“Difficult field conditions, remote locations, and persistent cloud cover (which interferes with satellite measurements) mean that long-term observations in the area are rare. But historical images like those taken by the US Navy can extend the record of glaciers by decades. Because the 3D model is made with such high-resolution imagery, the 1960s imagery is as good as what modern satellites can capture.”
Ryan said the historical imagery captured by the US Navy is a treasure trove for researchers seeking to understand how Antarctica has changed over the decades, particularly in light of the changing climate.
Drawing on 850 images, he said, was barely scratching the surface of what this vast archive contains.
“The information that these images contain about such a remote and often inaccessible location is priceless. In addition to glaciers, it can allow us to view sea ice extent, penguin colonies, moss growth, or freshwater lakes from up to 80 years ago.
“Archived data can be incredibly valuable and there are another 299,000 images waiting to be analysed.”
Originally published by the University of Wollongong
Read more
North, R. & Barrows, T.T. (2024) High-resolution elevation models of Larsen B glaciers extracted from 1960s imagery. Scientific Reports 14, 14536. https://doi.org/10.1038/s41598-024-65081-6
